
Epigenetics is the study of heritable patterns of gene expression that are independent of the underlying DNA sequence. The underlying mechanisms for such heritable patterns include chromatin remodeling and cytosine methylation.
Exploring cytosine methylation patterns, or the methylome, expands our understanding of cellular differentiation, ageing and many cancers. However, decoding the methylome through methyl-seq analysis presents unique challenges. These range from selecting the appropriate study method, to establishing a robust and reproducible methyl-seq data analysis pipeline — which is a complex, multi-step and error-prone process.
In this article, we explore DNA methylation and how Quark streamlines methyl-seq data analysis to produce robust, reproducible and reliable research insights.
What is DNA Methylation?
DNA methylation (DnaM) is the addition of a methyl group to a cytosine nucleotide in the DNA. Methylated cytosines are most commonly found in the human genome at cytosine-guanine (CpG) dinucleotide sites. They also occur less frequently in CHH or CHG contexts, where H represents A, C, or T.
Cytosine methylation modifies the responsivity of the surrounding DNA sequence to transcription effectors.
Significance of Exploring DNA Methylation
Cells use cytosine methylation to selectively control which genes are transcribed, and which are silenced. For example, in most cases, hypermethylation silences genes by making them less accessible for transcription. This mechanism is abnormally utilised in cancer cells, where genes that regulate vital processes like DNA damage repair or cellular adhesion are silenced through hypermethylation.
In contrast, oncogenic genes are hypomethylated in cancer cells, making them more accessible for transcription. Exploring the methylome can thus provide important context in research fields where the dynamics of gene expression patterns plays a pivotal role.
Decoding the methylome helps researchers to make guided clinical decisions and explore disease mechanisms. Combined with other multi-omics data, methyl-seq has tremendous application in personalising treatments for cancer and other diseases.
In addition to precision medicine applications, DNA methylation holds importance in ageing studies. Ageing is accompanied by genome-wide epigenetic alterations that influence lifespan. For example, studies on the longevity profiles of identical twins underscore the importance of DNA methylation in differentiating ageing-related diseases like diabetes and neurodegenerative disease. These studies further highlight the potential for reversing the effects of ageing in disease-specific contexts.
Methods to Study DNA Methylation
The gold-standard method to study DNA methylation is whole genome bisulfite sequencing (WGBS), which offers a wide coverage (~28M CpG sites) of the genome at base-pair resolution. However, it is expensive and requires high-quality DNA samples, which is why DNA methylation arrays are preferred — especially when the target methylation sites are known. Microarrays may be limited to predefined CpG sites, but they cover >900,000 CpG sites and are designed for high-throughput processing. They are widely used and cost-effective.
Other methods include reduced represented bisulfite sequencing (RRBS), which is a low-cost alternative to both WGBS and microarrays that covers ~5–10% of dense CpG islands in the genome.
We also have long-read sequencing technologies (PacBio and Oxford Nanopore) that directly detect methylated cytosines on native DNA sequences, but these have fewer data analysis pipelines and show higher error-rates compared to targeted approaches.
Choosing the appropriate method to profile DNA methylation patterns is crucial, and depends on several considerations: like resolution, budget and coverage requirements.
What is often overlooked is the necessity for robust, reproducible computational pipelines, which lays the foundation for integrative analysis.
Decoding the Methylome with Quark
With the rising importance of integrative multi-omics analysis in precision medicine and biomarker discovery, establishing standardised data analysis pipelines paves the way for robust and reliable biomarker insights.
Methyl Sequencing generates large volumes of data that need very specific quality control. Also, methylation patterns are inherently complex, challenging accurate data interpretation, analysis & visualization.
Quark simplifies this, accelerating epigenomics data analysis through swift, no-code visualizations, comprehensive quality control reports, & chromosme-level annotations.
Secondary Methyl-Seq Analysis on Quark
Users can navigate their results from a single dashboard, to:
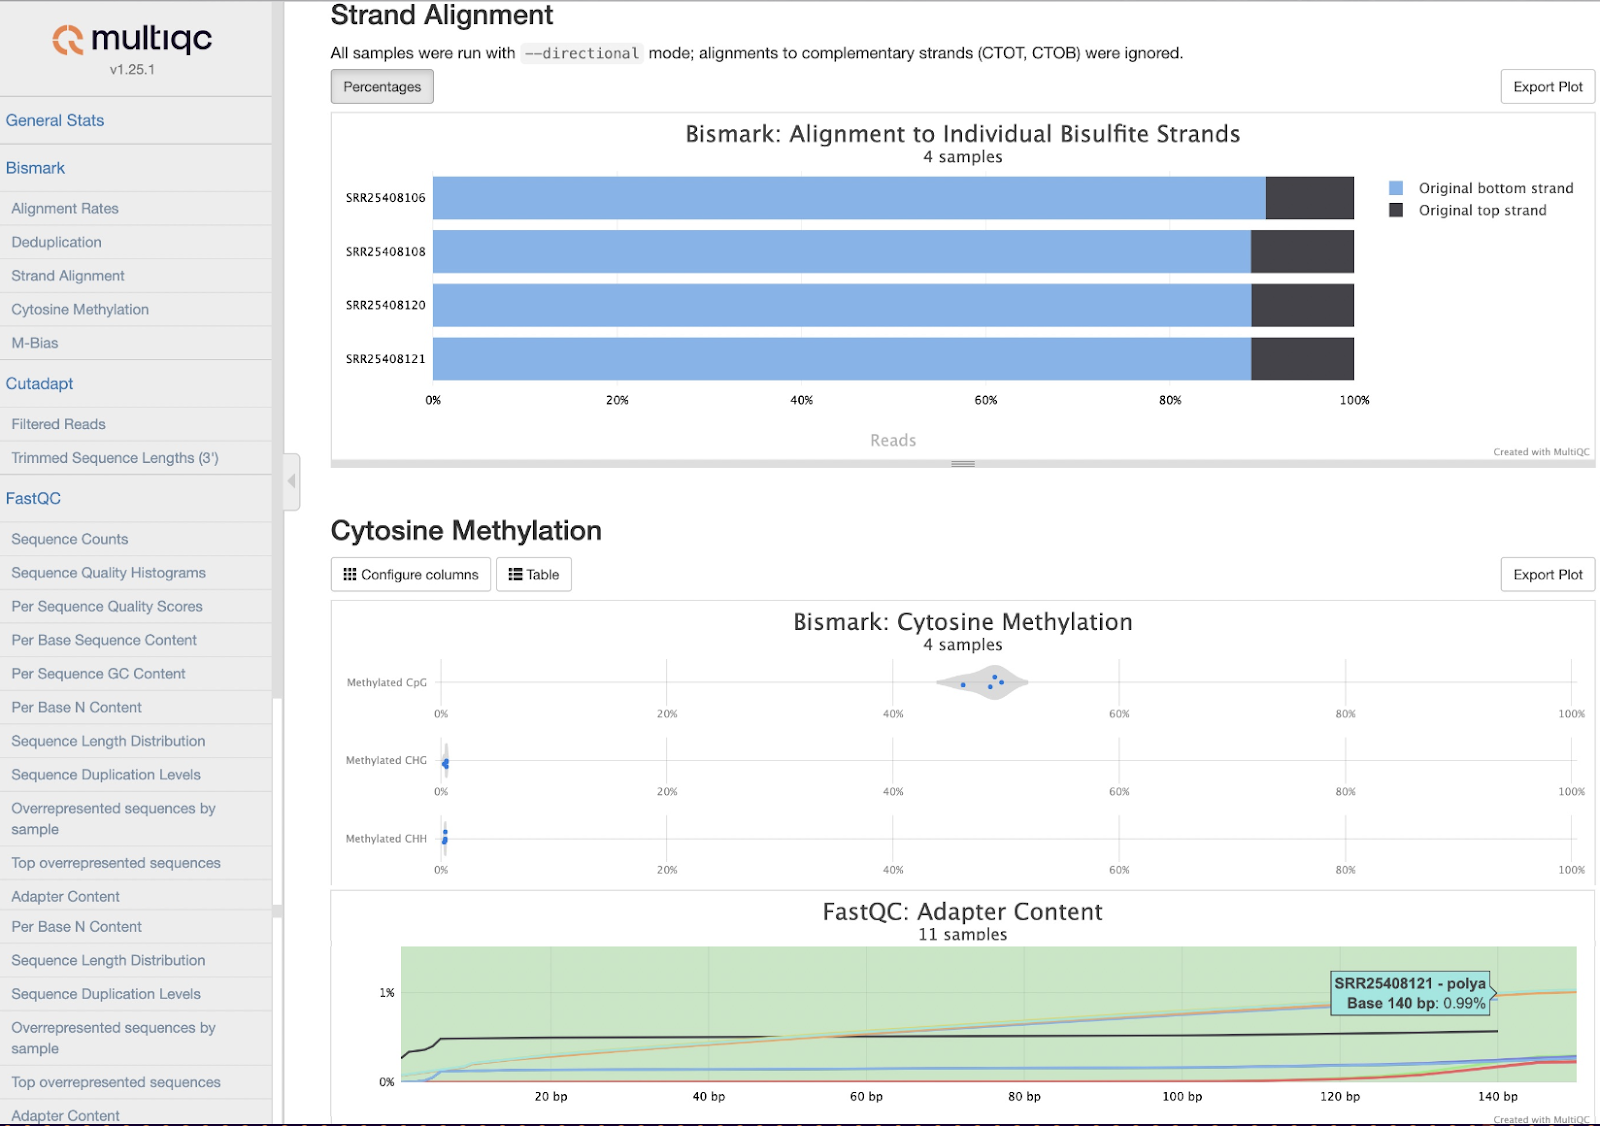
- Validate the mapping efficiency of bisulfite converted strands;

- Discover sample-level methylation patterns of CpG, CHH and CHG regions across the genome;
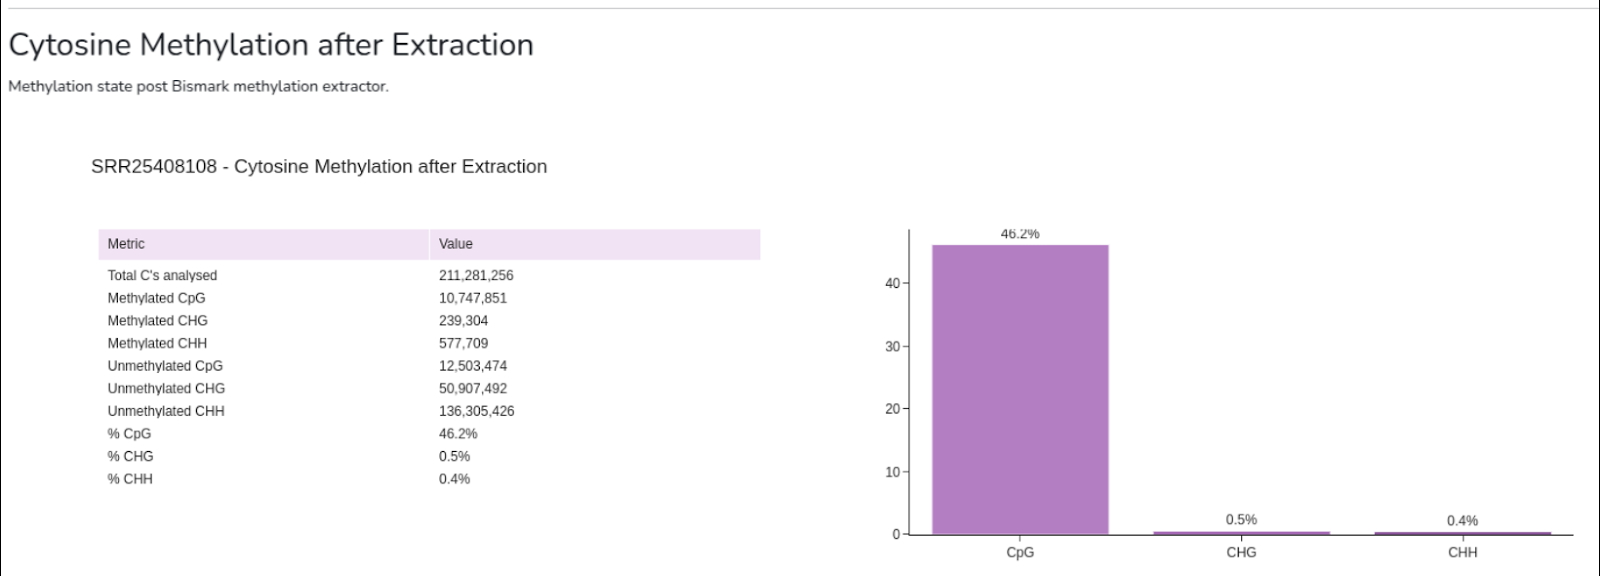
- Capture cytosine methylation statistics at the single-nucleotide level;
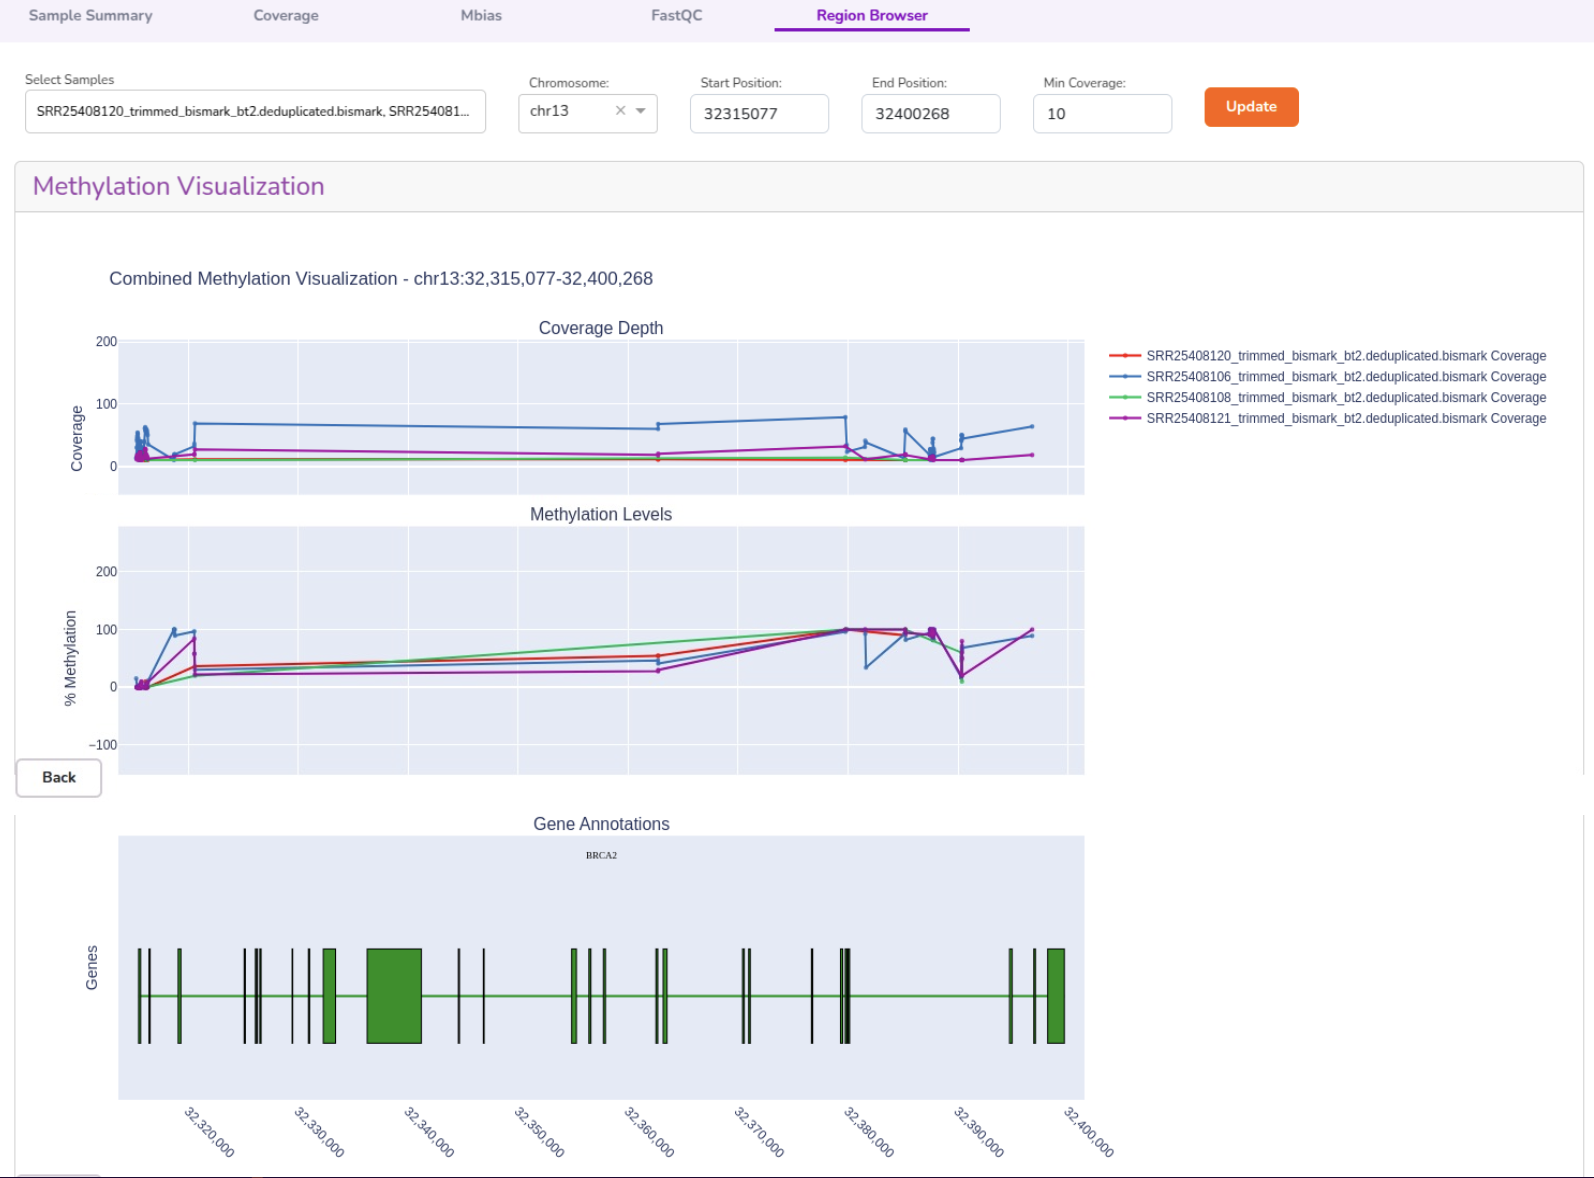
- Validate sequence coverage efficiency (coverage) and capture sample diversity of CpG methylation (percentage);

- Run quality checks with a comprehensive MultiQC report;
- View chromosomal region- or gene-specific epigenetic patterns with annotations.
Tertiary Methyl-Seq Analysis on Quark
Quark enables researchers to compare their cohorts and perform differential methylation analysis with a single-click, which instantly generates the following no-code visualizations.
- Differential Methylation Analysis
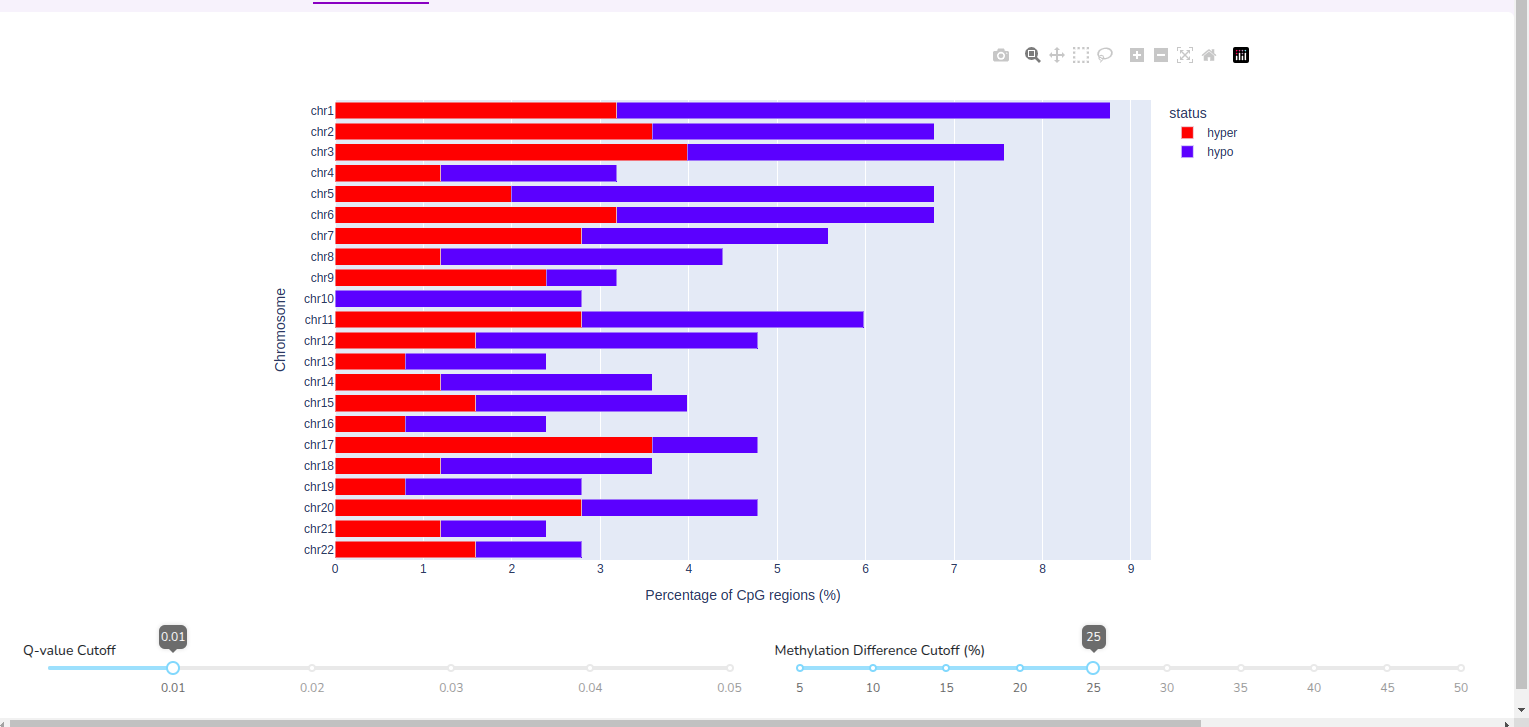
Compare cohorts and visualise global hyper– or hypo– methylated regions across 22 chromosomes.
Note that Quark performs normalization across cohort samples to ensure that sample-level coverage differences do not confound results. Methylation differences are calculated as deviations from the mean CpG percentage value.
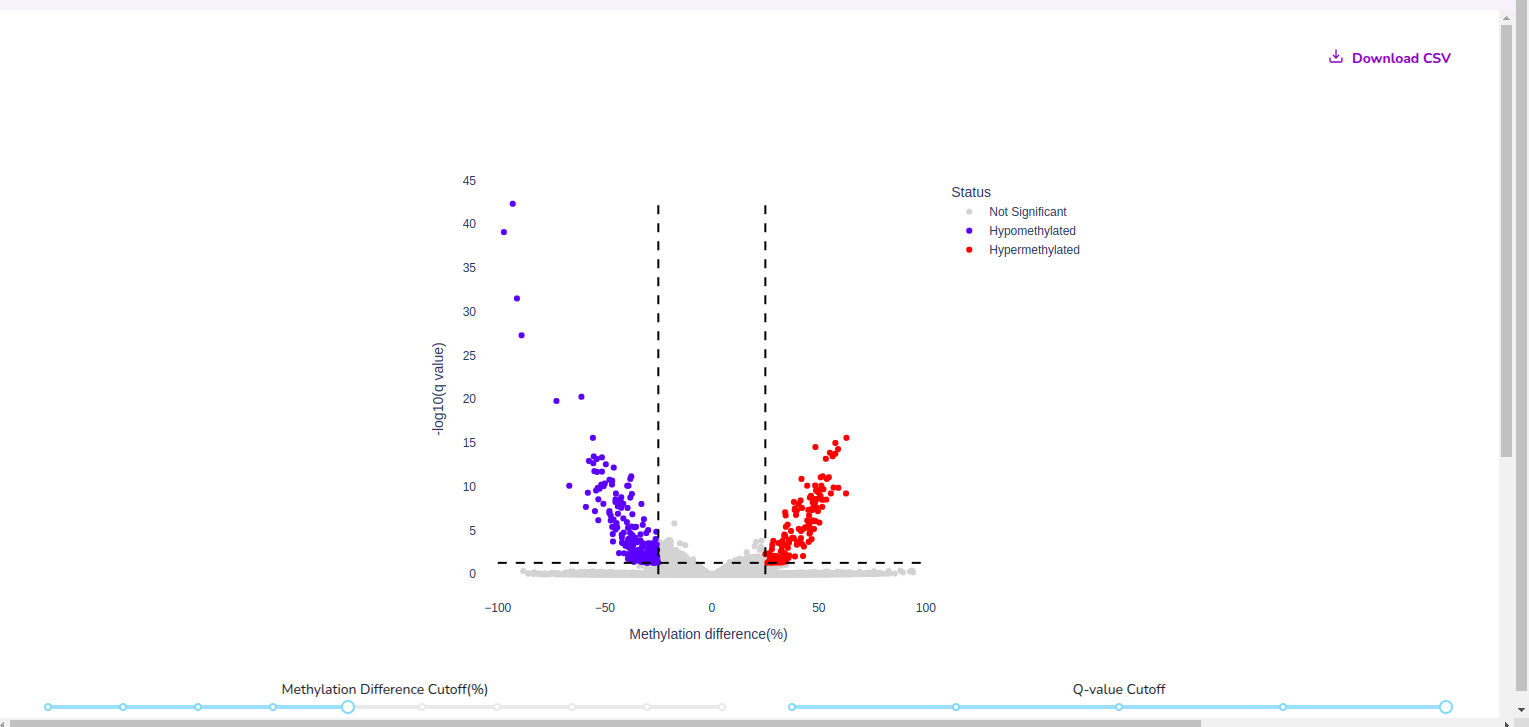
- By using Quark’s heat maps and volcano plots, users can instantly identify top chromosomal loci of interest that are differentially methylated between their cohorts.
These are simple yet powerful visualisation tools that accelerate early exploratory insights into Differentially Methylated Cytosines.

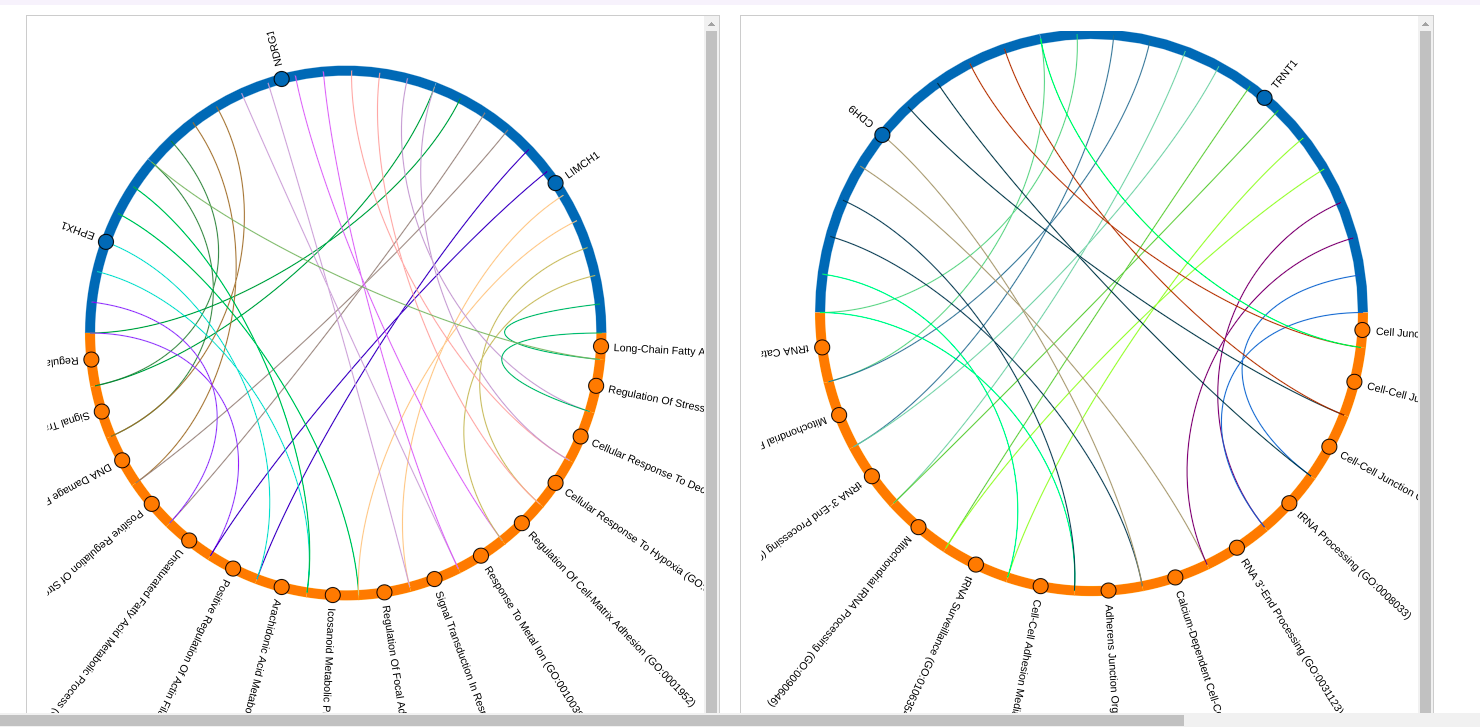
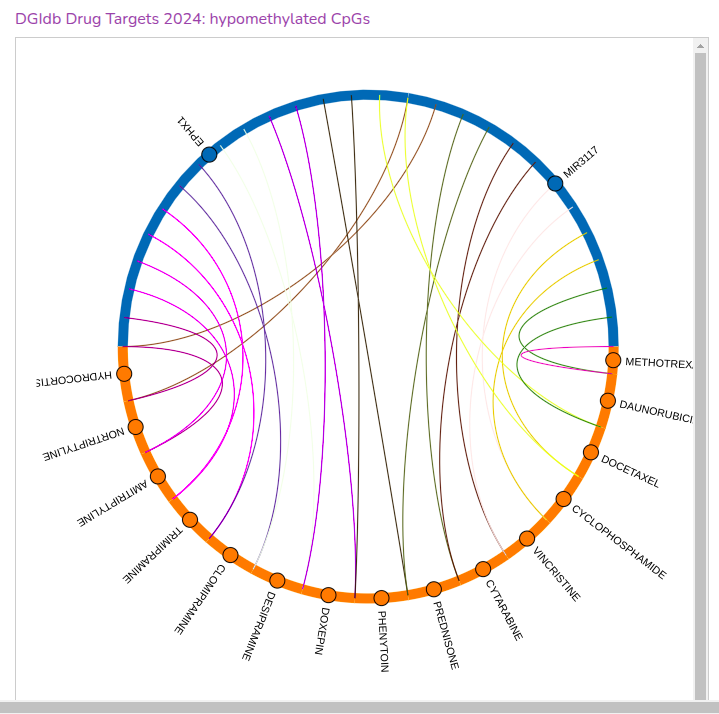
- Uncover associations between hyper– or hypo–methylated loci with various genes, drugs or pathways. The following plots visualise these associations, using data from the relevant database.

Conclusion
Methyl-seq analysis gives important epigenomic context that help researchers to make guided clinical decisions for precision medicine and target identification.
However, the availability of a range of methyl-seq methods often leads to divergent results that require integrative analysis. The foundation for this is to establish a simplified and reproducible bioinformatics workflow that ensures consistent and reliable research insights — which Quark empowers.
Additionally, methylation patterns are inherently complex, challenging accurate data interpretation, analysis & visualization. With Quark, users can navigate their results from a single dashboard, leverage powerful in-built analytics, and instantly download genes-to-pathways associations, thus accelerating their early exploratory analysis.
Request a demo to learn more about Quark.