

Blog 1 of 3 — The Knowledge Graph Series
In January 2020, when the world was just learning about COVID-19, a small team of scientists at BenevolentAI accomplished something that would typically take most drug development programmes five to ten years.
They identified a candidate treatment for COVID-19 in less than a month. A drug called baricitinib: an oral JAK inhibitor, already approved for treating rheumatoid arthritis.
Baricitinib wasn’t found in a new experiment. It was surfaced by a knowledge graph that made it possible for researchers to explore a multi-layered hypothesis:
“Does an approved drug connect, through its mechanism, to the biology of the coronavirus?”
Baricitinib went on to receive FDA emergency use authorisation (EUA) and in subsequent trials, it demonstrated a significant reduction in COVID-19 mortality. It is now a standard-of-care combination therapy treatment, improving the efficacy of remdesivir.
Which raises a question. Why did it need a knowledge graph, and not a database search or literature review, to find baricitinib?
Representing Complex Biomedical Data via Knowledge Graphs: The Value of Edges
In a knowledge graph, nodes are biological entities (such as specific genes, diseases, pathways, or drugs), and edges represent the relational lines or functional interactions between them. This structural setup allows complex, multi-dimensional data to be mapped into a unified network, turning isolated information into discoverable, hidden connections.
In the case of baricitinib, the data that led to its identification was publicly available, and its pharmacokinetic profile was well-characterised. Additionally, SARS-CoV-2’s viral entry mechanism, though newly published, was rapidly indexed and available as early as January 10, 2020.
So, every data point, entity, or node, existed. However, what was missing was an edge — the traversable connection between a rheumatoid arthritis drug’s inhibition profile and a lung virus’s host-cell entry pathway. These two bodies of knowledge sat in different databases, indexed under entirely separate domains of literature.
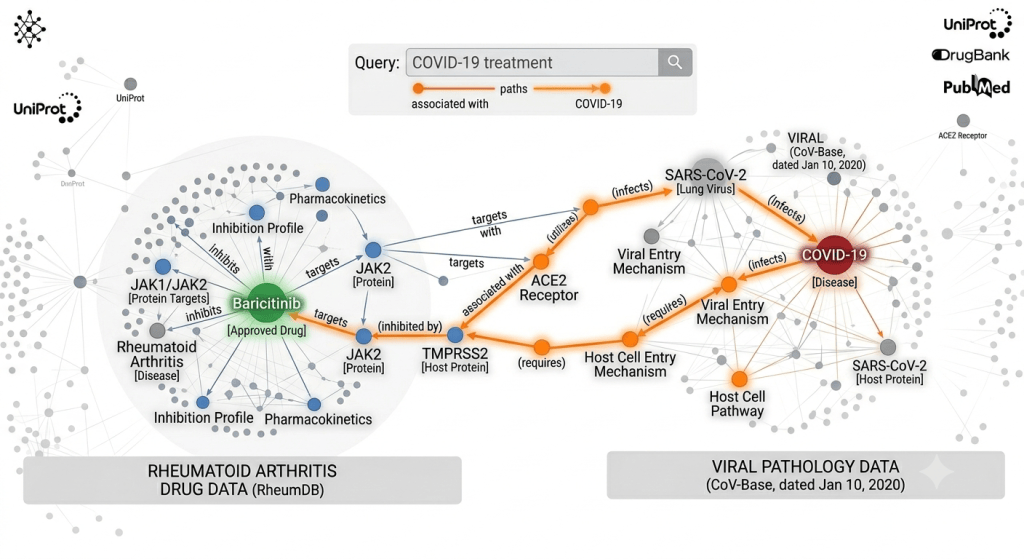
A knowledge graph connects drugs, targets, genes, biological mechanisms, and diseases into a single queryable structure. So, in the case of baricitinib, when queried in the context of COVID-19, the knowledge graph could traverse a path: disease → viral entry mechanism → host protein → inhibitor → approved drug.
That path crossed domain boundaries that a database search or literature review could not bridge.
Limitations of Isolated Hit Generation in CRISPR Screening: Beyond Ranked Gene Lists to Contextual Networks
A different form of the same problem plays out inside pharma organisations every day, at a smaller scale and with less drama, but with comparable consequence.
A CRISPR screen returns a ranked list of gene hits. Each hit is, technically, a candidate target. But a gene ID in isolation — without its pathway context, its protein interaction network, its disease associations, its prior drug history — is nearly meaningless for prioritisation.
A researcher looking at a list of five thousand genes has to manually assemble context that exists somewhere in the literature and in dozens of databases: a process that is “lengthy and laborious, often prone to individual bias.”
AstraZeneca built the Biological Insights Knowledge Graph (BIKG) to solve this. BIKG integrates more than 55 public and internal data sources into a unified structure — 14 million entities, over 146 million edges, spanning gene targets, pathways, biological processes, diseases, and compounds, including relationships extracted from the scientific literature.
When a CRISPR screen output is ingested into a knowledge graph, a translational scientist can immediately ask: “Which of these five thousand hits has a known protein interaction with a disease-relevant pathway? Which has independent experimental support from a completely different assay?”
In practice, this is exactly what BIKG demonstrated in a published study of EGFR-mutant non-small cell lung cancer. When graph-derived features were applied to re-rank CRISPR hits, they proved decisive in identifying drivers of resistance — providing biological context that CRISPR data alone could not surface.
What changed was not the experimental data or the CRISPR screen hits. It was the context.
Inside a knowledge graph, CRISPR hits are no longer isolated nodes. They become points of inferential power inside a connected network — surrounded by pathway membership, disease associations, and prior drug history. Context that determines whether the gene ID means anything at all.
The Clinical Challenge of Disconnected Data: When a Patient Has No Path
The same structural gap appears at the most consequential end of the spectrum: a patient with an undiagnosed rare disease.
Rare diseases place a peculiar stress on the research system. More than 95% remain untreatable, primarily because patients are sparse and distributed globally, making it nearly impossible to assemble the large cohorts that conventional statistical approaches require.
The standard response has been to connect more data through federated biobanks or population genomics initiatives. More patients, more statistical power – the right answer to the volume problem.
But for the individual patient already in the clinic — sequenced, phenotyped, and still undiagnosed — the volume problem is not the only binding constraint. Whole-genome and exome sequencing leave 50–75% of rare disease patients undiagnosed, despite the data being present. What’s missing is not more data — it’s the connection between the data.
This is where the inferential depth of a knowledge graph becomes directly relevant. It maximises the inferential value of each patient’s existing data, by connecting it to the full network of what’s already biologically known.
A variant in gene A may not have a direct recorded link to the patient’s phenotype. But gene A’s protein interacts with gene B’s protein. Gene B has a known association with a related phenotype cluster, and that cluster overlaps with the patient’s presentation. Finding this path requires multi-hop reasoning: traversing three hops across protein interaction networks, phenotype ontologies, and disease association databases, never previously connected for this patient.
And this is not hypothetical. SHEPHERD, a knowledge graph-based diagnostic system developed at Harvard and MIT and evaluated on 465 real patients from the NIH’s Undiagnosed Diseases Network, demonstrated exactly this: finding causal genes in cases where a patient’s symptoms were multiple hops away from the causative gene in the graph — paths that a direct database lookup would never surface.
This is what a knowledge graph can do: find the indirect path.
The Real Problem With Biomedical Data Is Structural
These three cases, reframed in terms of edges, context nodes and multi-hop paths, point to the same thing.
Biological data is not naturally tabular. It is a network — genes, proteins, pathways, phenotypes, diseases, and drugs — connected by relationships.
The moment that network is fragmented across incompatible systems, the reasoning that makes sense of it breaks down. Which is why it took a knowledge graph — and not a database search or a literature review — to surface baricitinib.
This structural breakdown operates at two levels. One one, data that is publicly available in repositories is still largely inaccessible, because it’s disconnected. Their data exists as isolated nodes in separate systems, but with no traversable edges between them.
On the second, more pervasive level, is the data silos problem. Pharmaceutical organisations generate vast quantities of data, but that data stays dark: evidence that is inaccessible and unpublished.
More than 50% of biomedical research output is estimated to be dark data — findings that never reach publication, buried in lab notebooks and internal file systems. For clinical trials alone, positive results are almost twice as likely to be published as negative ones, and over half of trial results remain unpublished 30 months after completion.
This data can’t be sent to a vendor’s cloud, to become restructured into a proprietary schema owned by someone else. So it stays dark, simply because the organisation doesn’t have the infrastructure to connect it without moving it.
When an organisation estimates that over 97% of its evidence base cannot be brought to bear on a given question, most of that 97% is not really hidden. It is sitting in plain sight, across dozens of well-maintained systems, in a form that simply cannot be connected to anything else, just because the edges were never drawn.
What Drawing the Edges Actually Means
Drawing those edges is not merely a data restructuring problem. It requires infrastructure built for the purpose.
A knowledge graph is, at its core, a query engine that traverses paths across a connected structure of entities as nodes and relationships as edges. Unlike a search engine, which retrieves documents, or a RAG system, which generates summaries from text chunks.
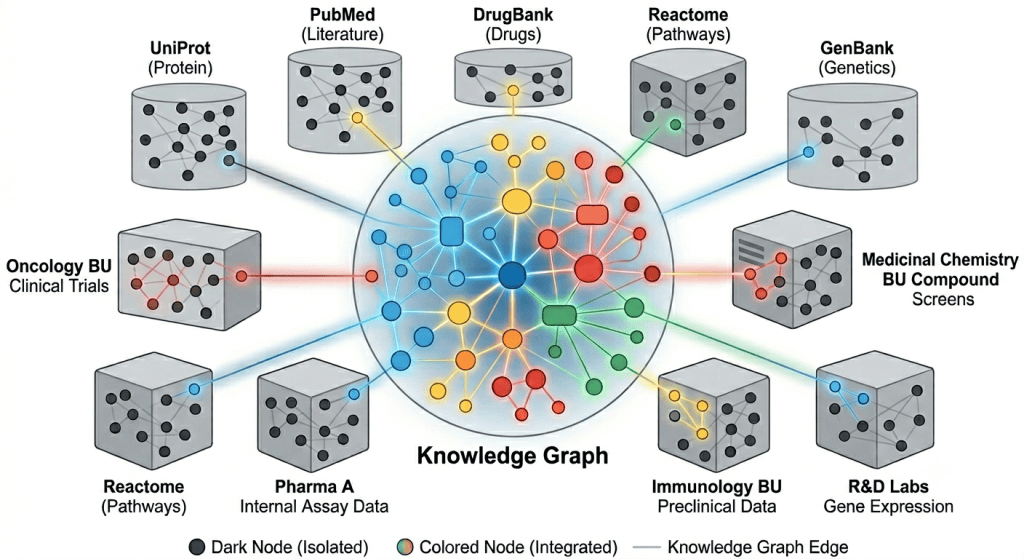
With a knowledge graph, researchers can follow the biology wherever it leads, regardless of which database, which data type, or which domain it crosses. And what makes it structurally different from any other data infrastructure is what happens next.
Every new data added to a knowledge graph — like a new HTS hit, or a tangential clinical observation — doesn’t just add nodes. It adds edges to everything already in the graph, exponentially increasing its inferential power.
This is as true for a public repository as it is for a proprietary drug screen that will never reach publication. The latter carries the most strategic weight for a pharmaceutical organisation. Quark Knowledge Graph is built on this principle: integrating proprietary experimental data — multi-omics, drug screens, negative results — alongside public repositories, inside a single traversable structure that the organisation owns outright.
A new multi-omics dataset doesn’t just sit alongside an existing knowledge base. Rather, it becomes entangled with it. New drug screen results connect, retroactively, to historical targets, and a newly added patient cohort can be traversed against an assay run three years ago.
In a knowledge graph, data is no longer static. It’s a compounding asset.
In the next post in this series, we look at what that compounding means in practice — why a knowledge graph is one of the rare R&D investments that appreciates over time, where the value of each experiment is determined not just by what it reveals on its own, but by what it connects to.
Quark Knowledge Graph deploys entirely within your infrastructure. Your data, your code, your graph.
Request a demo to learn more.