
Background
A crucial step in drug discovery is grouping patients into cohorts based on their genotypic or phenotypic features. Such cohorts are compared in tertiary data analysis to identify biomarkers related to a disease condition, like cancer.
Performing cohort comparison requires easy access to data and associated metadata, computational/bioinformatics skills, and a scalable platform that can analyze large volumes of multi-omics data.
Quark is a self-service bioinformatics platform that provides a scalable, reproducible and easy no-code analytics to perform exploratory multi-omics data analysis. Quark simplifies cohort comparison, and further enables reproducible exploratory analysis, through:
- interactive visualization tools, and
- unifying tertiary data analysis across multiple, multi-omics datasets.
In this blog we explore how cohort comparisons across multi-omics data samples are done, and how Quark expedites comparisons for tertiary data analysis.
Patient Stratification Into Cohorts: Importance in Exploratory Data Analysis
In clinical research, patients are stratified i.e. grouped together based on shared phenotypic or genotypic properties. For example, cancer trials may select patients based on genotypic features, depending on:
- whether they are positive for mutations in a marker gene associated with many cancers, such as BRAF (NCT01286753), or HRAS (NCT02383927).
- whether they over-express a biomarker gene, such as Human Epidermal Growth Factor 2 (HER2–NCT04579380) or Vascular Endothelial Growth Factor tyrosine kinases like MET (NCT00725764)
For exploratory data analysis, patients are most often stratified based on their response to a treatment i.e. whether they respond to a drug intervention, or are completely recalcitrant. Patients may also be grouped into different cohorts to compare different kinds of treatment.
Cohort comparison allows unique or defining cohort characteristics to stand out in tertiary data analysis, enabling clinicians to identify genes/proteins/gene expression profiles of interest. This has tremendous applications in precision medicine, where being able to identify unique genomic/transcriptomic/proteomic cancer profiles aids researchers to successfully tailor a targeted treatment plan to a patient.
In cancer, metagenomic and proteomic data are as important as genomic data, since they capture environmental factors (e.g. the tumor microenvironment) that promote a disease condition. Such factors can be mitigated with a combinatorial treatment.
Apart from cancer, multi-omics based cohort comparisons facilitate drug discovery and biomarker research for autoimmune disorders and genetic diseases.
However, the scope and scale of current multi-omics datasets with their vast volumes of multidimensional data complicates cohort comparisons. This is because researchers are challenged to quantitatively identify differences between cohorts without computational and technical skills.
Because of the complexity and scale of multi-omics datasets, interactive visualization tools are quintessential for tertiary data analysis. Visualization tools—such as Quark’s Analytics feature—should facilitate cohort comparisons based on multidimensional attributes. Quark’s suite of intuitive and interactive tools unifies data from all analytical pipelines (genomics, transcriptomics or metagenomics) for tertiary data analysis.
The following sections demonstrate how Quark empowers hypothesis-free data analysis of multi-omics datasets.
Creating and Comparing Cohorts on Quark
Quark provides rich and powerful analytics tools out-of-the-box, where cohorts can be created and compared effortlessly.
Regardless of the omics dataset or pipeline deployed, (for example, Quark DNA Seq. or RNA Seq. pipelines), all results are unified under a single ‘Analytics’ tab where researchers can easily build, retrieve, or modify cohorts for comparison.
Results of all processed samples are retrieved in the Analytics tab by providing Gene or Variant information, which will provide a list of matching Samples and Variants.
Sample tables can be filtered based on metadata such as patient ID, sex or status (like normal or tumour status).

Patient cohorts can also be built to identify biomarkers specific to a genotypic or phenotypic trait (such as in a treated vs. untreated cohort or normal vs. tumour samples).


Save stratified patients as a Cohort. Many such cohorts can be created based on a study’s requirements.
Once cohorts have been created, comparison can be done from the “Cohorts” tab on the Analytics page by selecting the cohorts of interest.

When the comparison completes, results are accessed from the “Analyses” tab, where the chart icon takes users to the page for tertiary or exploratory data analysis.

Exploratory Data Analysis
Researchers can perform early exploratory analyses like Differential Gene Expression (DGE), and Gene Enrichment Analysis out-of-the-box using Quark’s interactive visualizations.
Differential Gene Expression (DGE)
Researchers can draw insights from how expression patterns vary between two different cohorts. On Quark, the comparative distribution of gene expression between two cohorts is visualised as a volcano plot.

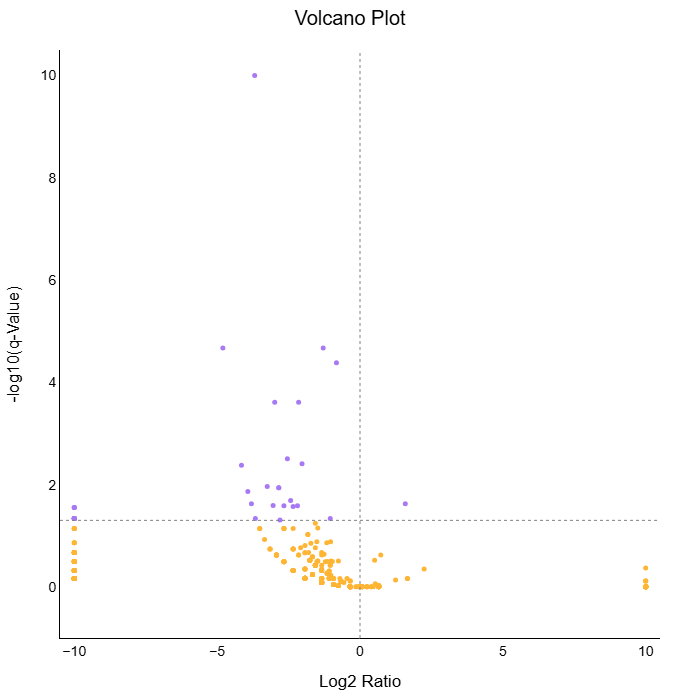
Fig 5a: Volcano plot for DGE from RNA (top panel) and DNA Sequencing (bottom panel) Pipelines. The table lists genes identified to be differentially expressed in the two cohorts
Additionally, researchers can use visualization tools to compare altered gene frequencies or gene expression levels between cohorts for specific genes.

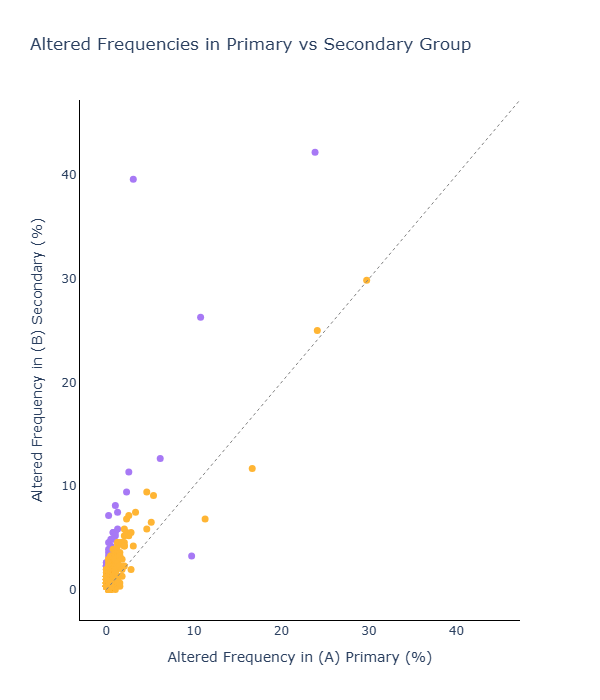

Fig 5b (left panel): Heatmap differences in gene expression (RNA Seq) for select genes and (right panels): Altered gene frequencies between cohorts (DNA Seq)
Enrichment Analysis
Enrichment Analysis allows researchers to identify the diseases, Molecular Pathways and Gene Ontologies (GO) that are enriched.
For example, if a specific signalling pathway associated with inflammation is enriched, or genes related to the transcription of a specific protein associated with tumorigenesis is over-represented, researchers can easily visualise and download the enriched GO terms to draw further insights about their samples.

Conclusion
Interactive data visualisation tools simplify patient stratification and cohort comparisons for multidimensional datasets. On Quark, results of genomics, transcriptomics and metagenomics datasets are unified on a single analyses tab so that the same cohort can be compared with others in multiple dimensions.
Thus, Quark leverages computational analytics to provide easy-to-adopt tools that harness the full scope of multi-omics datasets. The final results provide a holistic snapshot of a disease-contributing profile that includes attributes from genomics, transcriptomics and metagenomics datasets.
Cohort creation and comparisons are simplified on the platform’s intuitive interface, shortening the times required for tertiary data analysis and thus accelerating biomarker validation and drug discovery.
Schedule a demo with us and learn more about Quark.
1 comment